Two Reasons Why Today’s Housing Market Isn’t a Bubble

You may be reading headlines and hearing talk about a potential housing bubble or a crash, but it’s important to understand that the data and expert opinions tell a different story. A recent survey from Pulsenomics asked over one hundred housing market experts and real estate economists if they believe the housing market is in a bubble. The results indicate most experts don’t think that’s the case (see graph below):
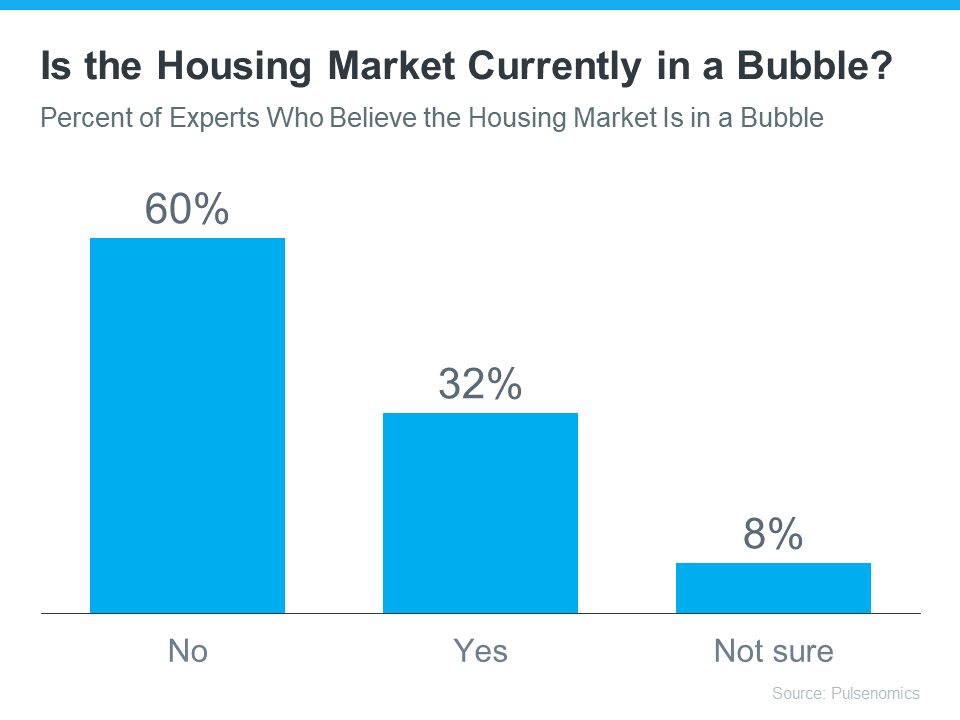 As the graph shows, a strong majority (60%) said the real estate market is not currently in a bubble. In the same survey, experts give the following reasons why this isn’t like 2008:
- The recent growth in home prices is because of demographics and low inventory
- Credit risks are low because underwriting and lending standards are sound
If you’re concerned a crash may be coming, here’s a deep dive into those two key factors that should help ease your concerns.
1. Low Housing Inventory Is Causing Home Prices To Rise
The supply of homes available for sale needed to sustain a normal real estate market is approximately six months. Anything more than that is an overabundance and will causes prices to depreciate. Anything less than that is a shortage and will lead to continued price appreciation.
As the graph below shows, there were too many homes for sale from 2007 to 2010 (many of which were short sales and foreclosures), and that caused prices to tumble. Today, there’s still a shortage of inventory, which is causing ongoing home price appreciation (see graph below):
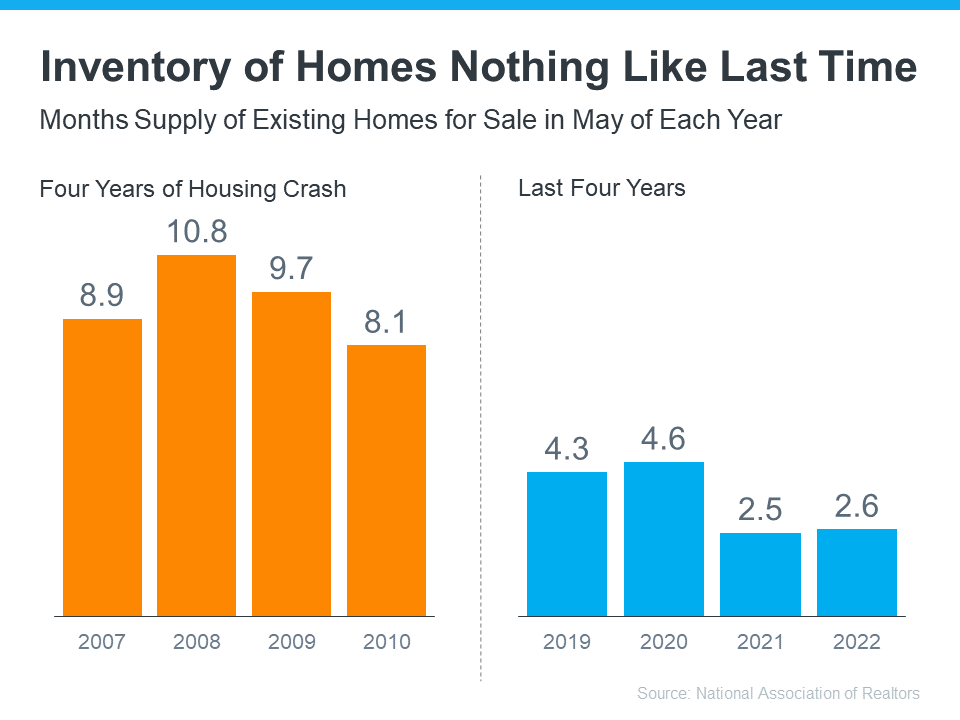 Inventory is nothing like the last time. Prices are rising because there’s a healthy demand for homeownership at the same time there’s a limited supply of homes for sale. Odeta Kushi, Deputy Chief Economist at First American, explains:
“The fundamentals driving house price growth in the U.S. remain intact. . . . The demand for homes continues to exceed the supply of homes for sale, which is keeping house price growth high.”
2. Mortgage Lending Standards Today Are Nothing Like the Last Time
During the housing bubble, it was much easier to get a mortgage than it is today. Here’s a graph showing the mortgage volume issued to purchasers with a credit score less than 620 during the housing boom, and the subsequent volume in the years after:
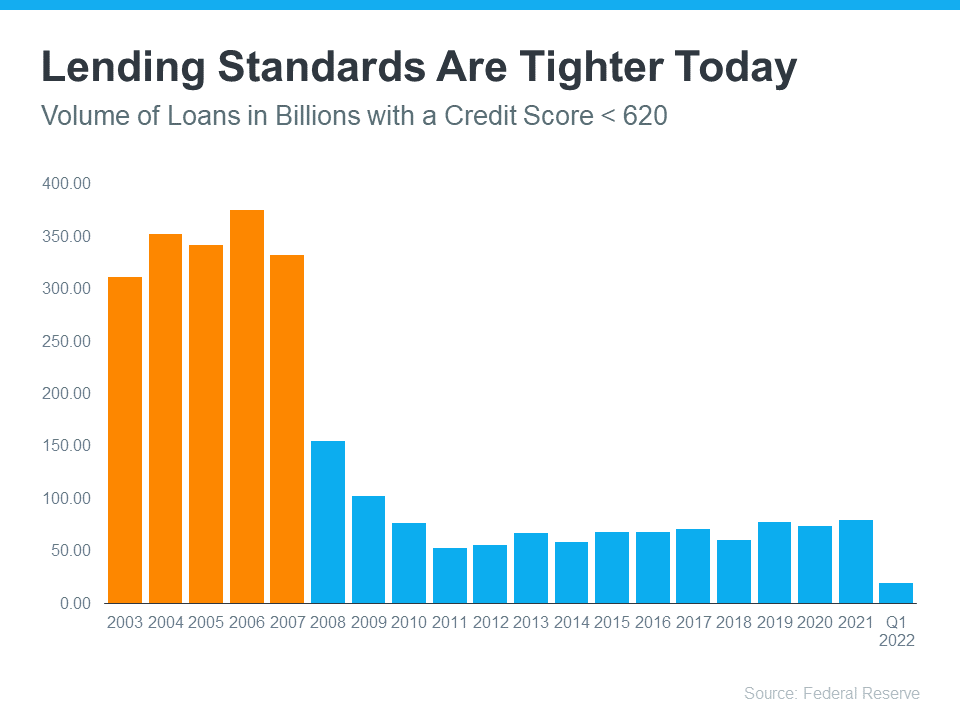 This graph helps show one element of why mortgage standards are nothing like they were the last time. Purchasers who acquired a mortgage over the last decade are much more qualified than they were in the years leading up to the crash. Realtor.com notes:
“. . . Lenders are giving mortgages only to the most qualified borrowers. These buyers are less likely to wind up in foreclosure.”
Bottom Line
A majority of experts agree we’re not in a housing bubble. That’s because home price growth is backed by strong housing market fundamentals and lending standards are much tighter today.
The Average Homeowner Gained $64K in Equity over the Past Year

If you own a home, your net worth likely just got a big boost thanks to rising home equity. Equity is the current value of your home minus what you owe on the loan. And today, based on recent home price appreciation, you’re building that equity far faster than you may expect – here’s how it works.
Because there’s an ongoing imbalance between the number of homes available for sale and the number of buyers looking to make a purchase, home prices are on the rise. That means your home is worth more in today’s market because it’s in high demand. As Patrick Dodd, President and CEO of CoreLogic, explains:
“Price growth is the key ingredient for the creation of home equity wealth. . . . This has led to the largest one-year gain in average home equity wealth for owners. . . .”
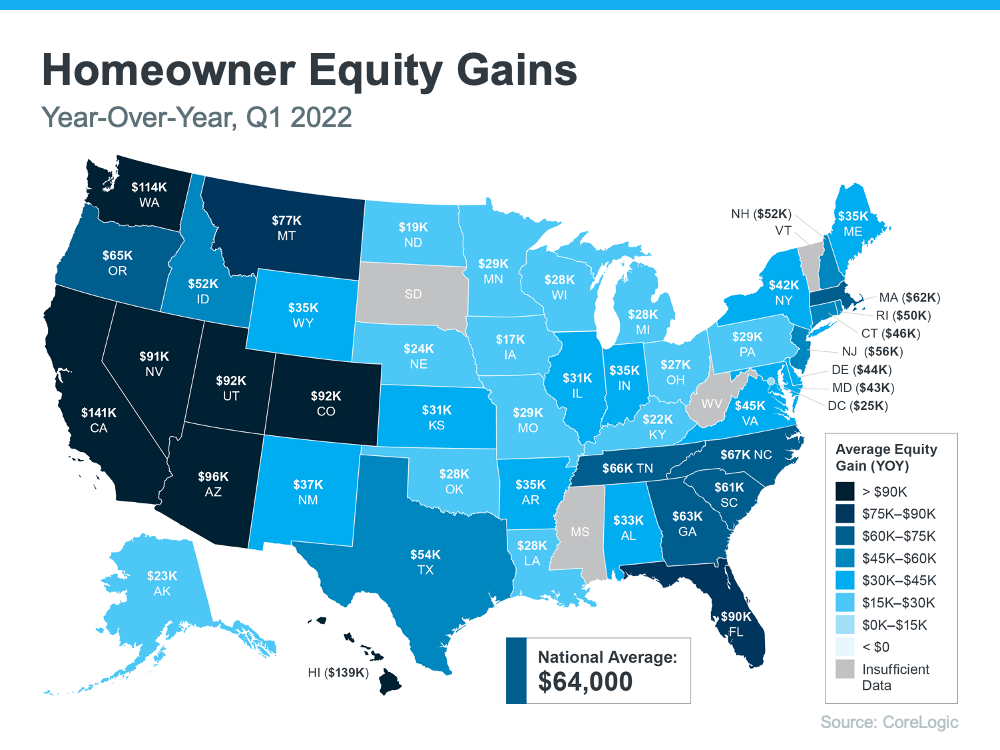
Basically, because your home value has likely climbed so much, your equity has increased too. According to the latest Homeowner Equity Insights from CoreLogic, the average homeowner’s equity has grown by $64,000 over the last 12 months.
While that’s the nationwide number, if you want to know what’s happening in your area, look at the map below. It breaks down the average year-over-year equity growth for each state using the data from CoreLogic.
The Opportunity Your Rising Home Equity Provides
In addition to building your overall net worth, equity can also help you achieve other goals like buying your next home. When you sell your current house, the equity you built up comes back to you in the sale. In a market where homeowners are gaining so much equity, it may be just what you need to cover a large portion – if not all – of the down payment on your next home.
So, if you’ve been holding off on selling or you’re worried about being priced out of your next home because of today’s ongoing home price appreciation, rest assured your equity can help fuel your move.
Bottom Line
If you’re planning to make a move, the equity you’ve gained can make a big impact. To find out just how much equity you have in your current home and how you can use it to fuel your next purchase, reach out to your trusted real estate advisor so you can get a professional equity assessment report on your house.
Home Price Deceleration Doesn’t Mean Home Price Depreciation

Experts in the real estate industry use a number of terms when they talk about what’s happening with home prices. And some of those words sound a bit similar but mean very different things. To help clarify what’s happening with home prices and where experts say they’re going, here’s a look at a few terms you may hear:
- Appreciation is when home prices increase.
- Depreciation is when home prices decrease.
- Deceleration is when home prices continue to appreciate but at a slower pace.
Where Home Prices Have Been in Recent Years
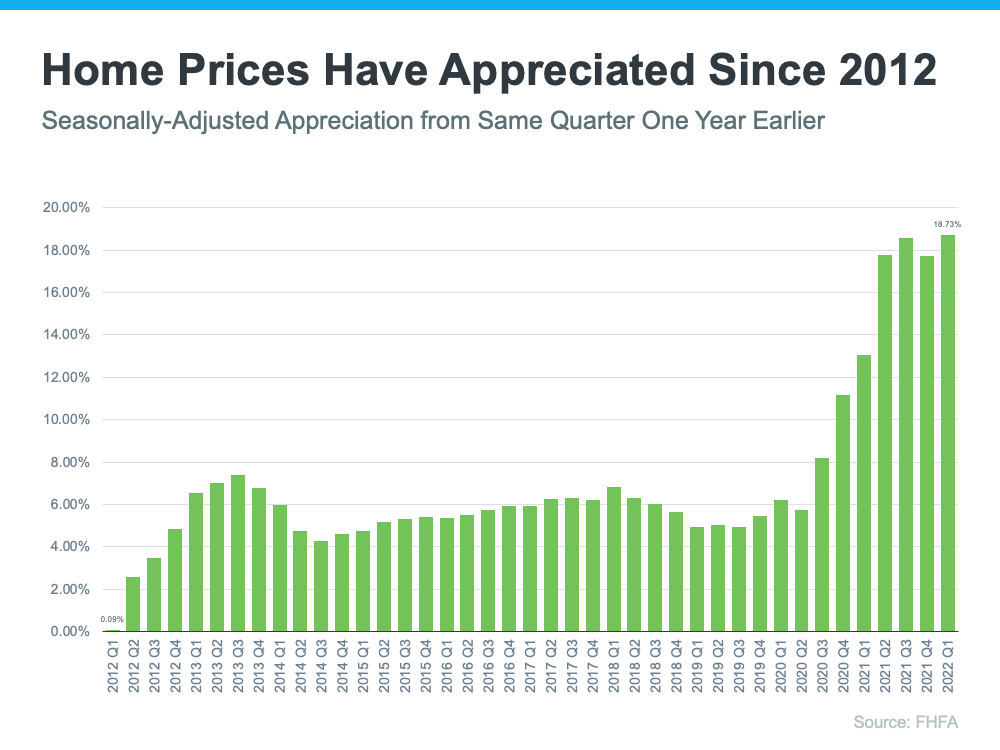
For starters, you’ve probably heard home prices have skyrocketed over the past two years, but homes were actually appreciating long before that. You might be surprised to learn that home prices have climbed for 122 consecutive months (see graph below):
As the graph shows, houses have gained value consistently over the past 10 consecutive years. But since 2020, the increase has been more dramatic as home price growth accelerated.
So why did home prices climb so much? It’s because there were more buyers than there were homes for sale. That imbalance put upward pressure on home prices because demand was high and supply was low.
Where Experts Say Home Prices Are Going
While this is helpful context, if you’re a buyer or seller in today’s market, you probably want to know what’s going to happen with home prices moving forward. Will they continue that same growth path or will home prices fall?
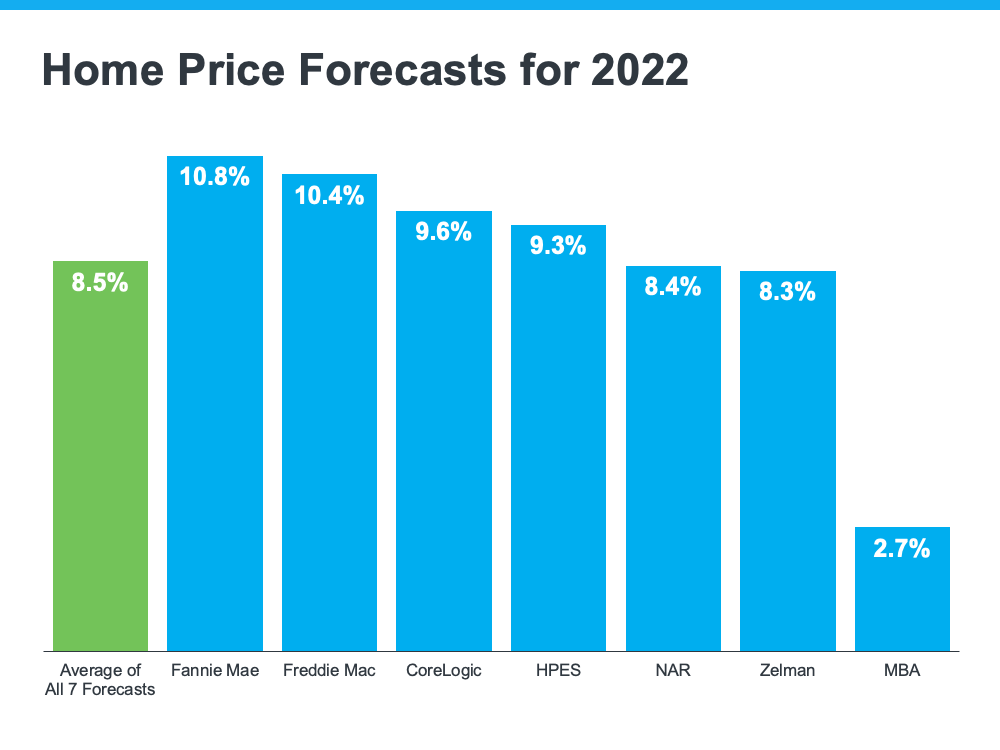
Experts are forecasting ongoing appreciation, just at a decelerated pace. In other words, prices will keep climbing, just not as fast as they have been. The graph below shows home price forecasts from seven industry leaders. None are calling for prices to fall (see graph below):
Mark Fleming, Chief Economist at First American, identifies a key reason why home prices won’t depreciate or drop:
“In today’s housing market, demand for homes continues to outpace supply, which is keeping the pressure on house prices, so don’t expect house prices to decline.”
And although housing supply is starting to tick up, it’s not enough to make home prices decline because there’s still a gap between the number of homes available for sale and the volume of buyers looking to make a purchase.
Terry Loebs, Founder of the research firm Pulsenomics, notes that most real estate experts and economists anticipate home prices will continue rising. As he puts it:
“With home values at record-high levels and a vast majority of experts projecting additional price increases this year and beyond, home prices and expectations remain buoyant.”
Bottom Line
Experts forecast price deceleration, not depreciation. That means home prices will continue to rise, just at a slower pace. Let’s connect so you can get the full picture of what’s happening with home prices in our local market and to discuss your buying and/or selling goals.
Is the Housing Market Correcting?

If you’re following the news, all of the headlines about conditions in the current housing market may leave you with more questions than answers. Is the boom over? Is the market crashing or correcting? Here’s what you need to know.
The housing market is moderating compared to the last two years, but what everyone needs to remember is that the past two years were record-breaking in nearly every way. Record-low mortgage rates and millennials reaching peak homebuying years led to an influx of buyer demand. At the same time, there weren’t enough homes available to purchase thanks to many years of underbuilding and sellers who held off on listing their homes due to the health crisis.
This combination led to record-high demand and record-low supply, and that wasn’t going to be sustainable for the long term. The latest data shows early signs of a shift back to the market pace seen in the years leading up to the pandemic – not a crash nor a correction. As realtor.com says:
“The housing market is at a turning point. . . . We’re starting to see signs of a new direction, . . .”
Home Showings Then and Now
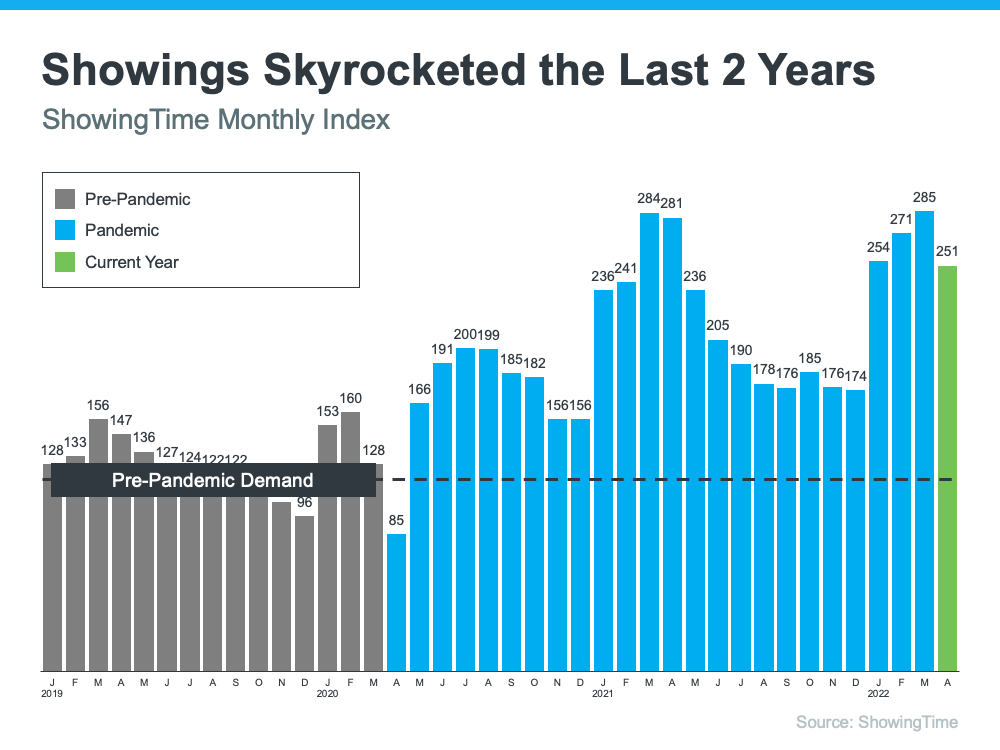
The ShowingTime Showing Index tracks the traffic of home showings according to agents and brokers. It’s a good indication of buyer demand. Here’s a look at that data going back to 2019 (see graph below):
The 2019 numbers give a good baseline of pre-pandemic demand (shown in gray). As the graph indicates, home showings skyrocketed during the pandemic (shown in blue). And while current buyer demand has begun to moderate slightly based on the latest data (shown in green), showings are still above 2019 levels.
And since 2019 was such a strong year for the housing market, this helps show that the market isn’t crashing – it’s just at a turning point that’s moving back toward more pre-pandemic levels.
Existing Home Sales Then and Now
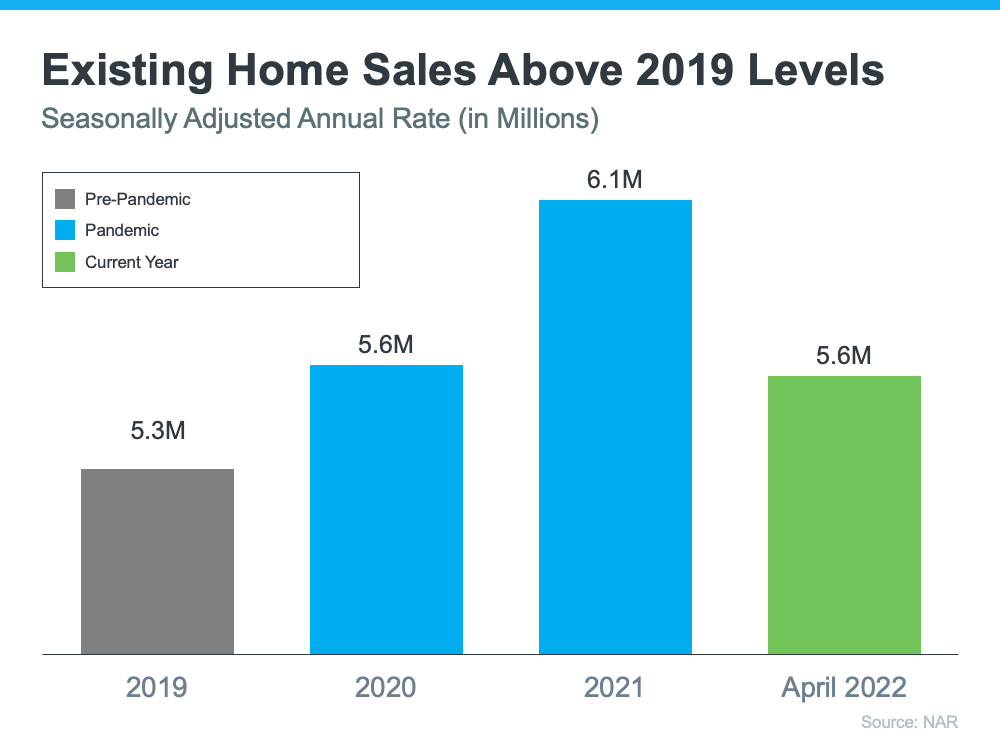
Headlines are also talking about how existing home sales are declining, but perspective matters. Here’s a look at existing home sales going all the way back to 2019 using data from the National Association of Realtors (NAR) (see graph below):
Again, a similar story emerges. The pandemic numbers (shown in blue) beat the more typical year of 2019 home sales (shown in gray). And according to the latest projections for 2022 (shown in green), the market is on pace to close this year with more home sales than 2019 as well.
It’s important to compare today not to the abnormal pandemic years, but to the most recent normal year to show the current housing market is still strong. First American sums it up like this:
“. . . today’s housing market looks a lot like the 2019 housing market, which was the strongest housing market in a decade at the time.”
Bottom Line
If recent headlines are generating any concerns, look at a more typical year for perspective. The current market is not a crash or correction. It’s just a turning point toward normalization.
Why the Growing Number of Homes for Sale Is Good for Your Move Up

Are you thinking about selling your current home? If so, the biggest question on your mind may be: if I sell now, where will I go? If this resonates with you, there’s something you should know. The number of homes coming onto the market is increasing and that could make it easier for you to move up this summer.
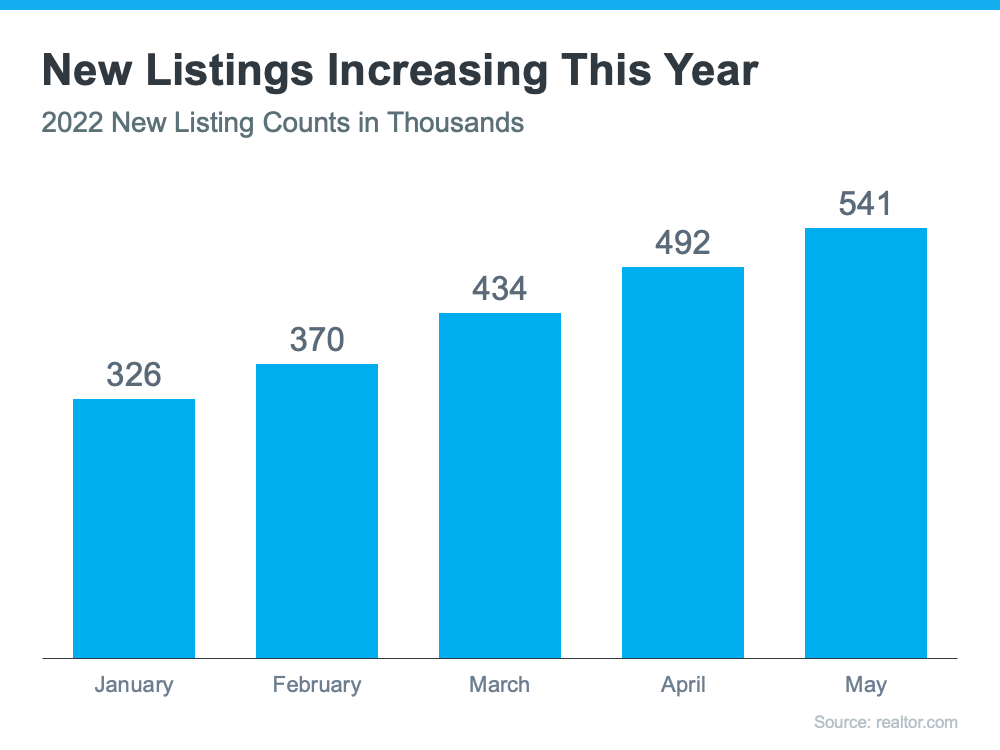
According to the latest data from realtor.com, the number of homes being listed for sale, known as new listings, has increased consistently this year (see graph below):
While this news has clear benefits for buyers who are craving more options for their home search, what does that mean for current homeowners like you? It gives you two distinct opportunities in today’s housing market.
Opportunity #1: Take Advantage of More Options for Your Move Up
If your current house no longer meets your needs or lacks the space and features you want, this gives you even more opportunity to sell and move up into the home of your dreams. As more options come to market, you’ll have more to choose from when you search for your next home.
Partnering with a local real estate professional can help make sure you see these listings as soon as they come onto the market. And when you do find the one, that professional can advise you on how to write a winning offer to seal the deal.
Opportunity #2: Sell Before You Have More Competition
Just know that, in order to make sure your house shines above the rest, it may make sense to put your home up for sale before your neighbors do the same, creating more competition in your area. The increase in the number of homes being listed for sale is expected to continue, and a recent study from realtor.com says two-thirds of homeowners looking to sell say they’ll do so by August.
A real estate professional can advise you on what you need to tackle to get your house ready to list so they can put that for sale sign up in your yard sooner rather than later. That’s because the process of getting a home ready to sell isn’t taking as long as you may think. As a result, you can capitalize on today’s sellers’ market and get ahead of the competition.
Bottom Line
If you’re a current homeowner looking to sell, you have a unique opportunity to benefit from the additional homes being listed today and sell before your house has more competition.
History Proves Recession Doesn’t Equal a Housing Crisis [INFOGRAPHIC]
![History Proves Recession Doesn’t Equal a Housing Crisis [INFOGRAPHIC] | MyKCM](https://files.mykcm.com/2022/06/02165354/20220603-MEM-2-1046x1949.png)
Some Highlights
- It’s important to understand history proves an economic slowdown does not equal a housing crisis.
- In 4 of the last 6 recessions, home prices actually appreciated. Home prices only fell twice – minimally in the early 90s and then by nearly 20% during the housing crash in 2008.
- If you have questions, let’s connect to discuss why today’s housing market is nothing like 2008.
Why Home Loans Today Aren’t What They Were in the Past
In today’s housing market, many are beginning to wonder if we’re returning to the riskier lending habits and borrowing options that led to the housing crash 15 years ago. Let’s ease those concerns.
Several times a year, the Mortgage Bankers Association (MBA) releases an index titled the Mortgage Credit Availability Index (MCAI). According to their website:
“The MCAI provides the only standardized quantitative index that is solely focused on mortgage credit. The MCAI is . . . a summary measure which indicates the availability of mortgage credit at a point in time.”
Basically, the index determines how easy it is to get a mortgage. The higher the index, the more available mortgage credit becomes. Here’s a graph of the MCAI dating back to 2004, when the data first became available:
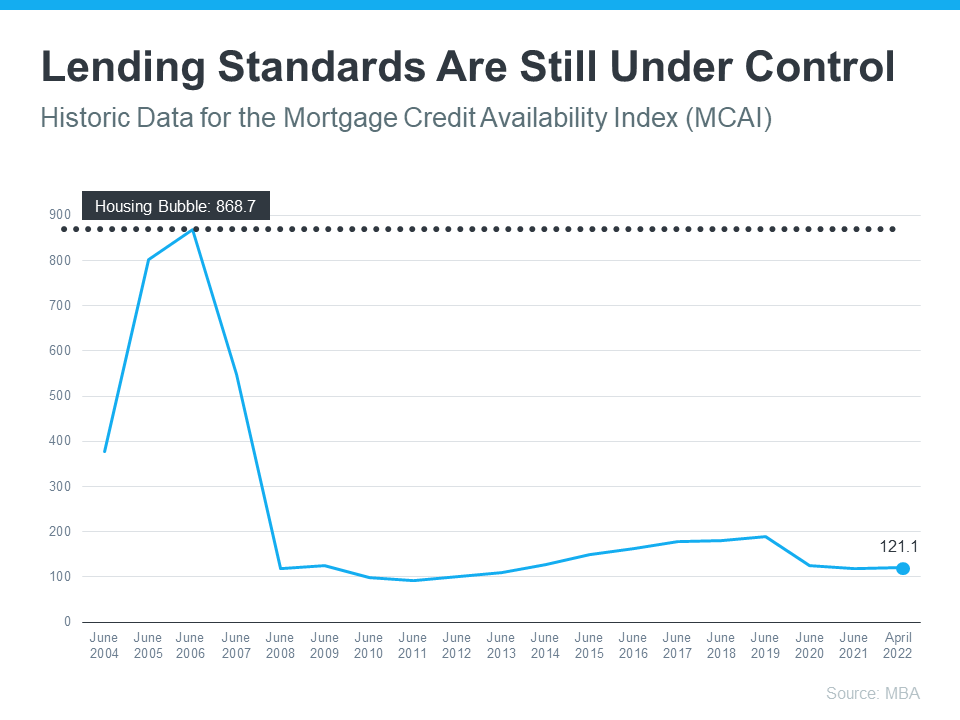 As the graph shows, the index stood at about 400 in 2004. Mortgage credit became more available as the housing market heated up, and then the index passed 850 in 2006. When the real estate market crashed, so did the MCAI as mortgage money became almost impossible to secure. Thankfully, lending standards have eased somewhat since then, but the index is still low. In April, the index was at 121, which is about one-seventh of what it was in 2006.
Why Did the Index Get out of Control During the Housing Bubble?
The main reason was the availability of loans with extremely weak lending standards. To keep up with demand in 2006, many mortgage lenders offered loans that put little emphasis on the eligibility of the borrower. Lenders were approving loans without always going through a verification process to confirm if the borrower would likely be able to repay the loan.
An example of the relaxed lending standards leading up to the housing crash is the FICO® credit score associated with a loan. What’s a FICO® score? The website myFICO explains:
“A credit score tells lenders about your creditworthiness (how likely you are to pay back a loan based on your credit history). It is calculated using the information in your credit reports. FICO® Scores are the standard for credit scores—used by 90% of top lenders.”
During the housing boom, many mortgages were written for borrowers with a FICO score under 620. While there are still some loan programs that allow for a 620 score, today’s lending standards are much tighter. Lending institutions overall are much more attentive about measuring risk when approving loans. According to the latest Household Debt and Credit Report from the New York Federal Reserve, the median credit score on all mortgage loans originated in the first quarter of 2022 was 776.
The graph below shows the billions of dollars in mortgage money given annually to borrowers with a credit score under 620.
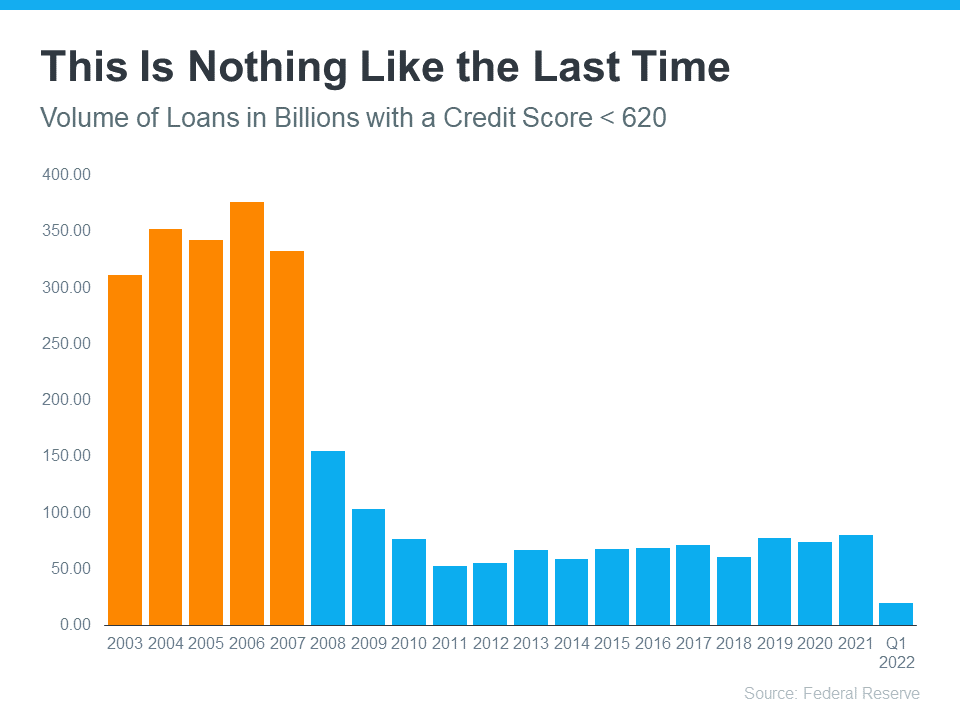 In 2006, buyers with a score under 620 received $376 billion dollars in loans. In 2021, that number was only $80 billion, and it’s only $20 billion in the first quarter of 2022.
Bottom Line
In 2006, lending standards were much more relaxed with little evaluation done to measure a borrower’s potential to repay their loan. Today, standards are tighter, and the risk is reduced for both lenders and borrowers. These are two very different housing markets, and today is nothing like the last time.

 Facebook
 X
X
 Pinterest
 Copy Link

