 Facebook
 X
X
 Pinterest
 Copy Link
Want Top Dollar for Your House? Now’s the Time To List It.

When you’re selling any item, you usually want to sell it for the greatest profit possible. That happens when there’s a strong demand and a limited supply for that item. In the real estate market, that time is right now. If you’re thinking of selling your house this year, here are two reasons why now’s the time to list.
1. Demand Is Very Strong This Winter
A recent article in Inman News explains:
“Spring, the hottest time of year for homebuyers and sellers, has started early, according to economists. . . . ‘Home shopping season appears to already be in full swing!’”
And they aren’t the only ones saying buyers are already out in full force. That claim is backed up with data released last week by ShowingTime. The ShowingTime Showing Index tracks the average number of monthly buyer showings on active residential properties, which is a highly reliable leading indicator of current and future trends for buyer demand. The latest index reveals this December was the most active December in five years (see graph below):
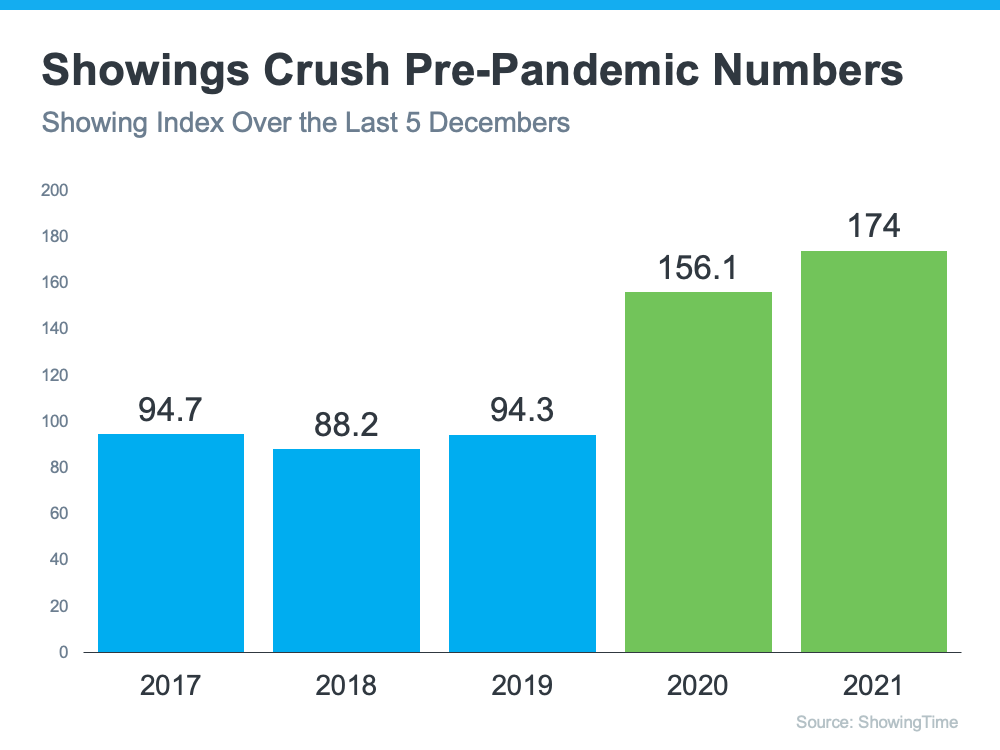
As the data indicates, buyers are very active this winter. Last December saw even more showings than December of 2020, which was already a stronger-than-usual winter. And remember – you want to sell something when there’s a strong demand for that item. That time is now.
2. Housing Supply Is Extremely Low
Each month, realtor.com releases data on the number of active residential real estate listings (listings currently for sale). Their most recent report reveals the latest monthly number is the lowest we’ve seen in any January since 2017 (see graph below):
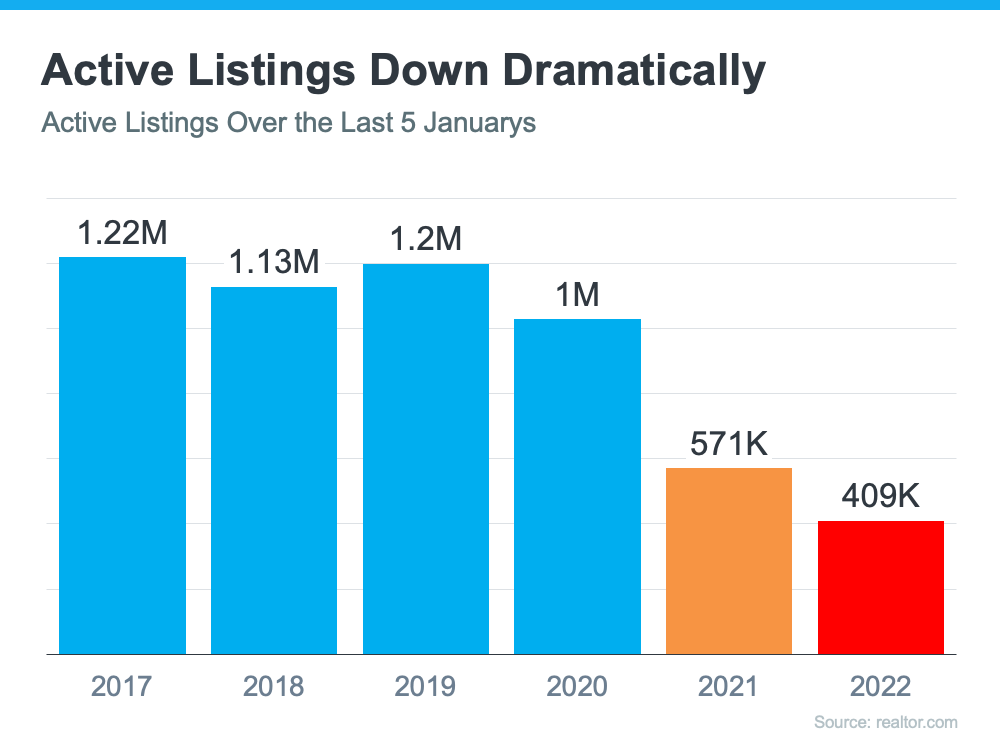
And don’t forget, the best time to sell an item is when there’s a limited supply of it available. This graph clearly shows how extremely low housing supply is today.
Even Though Supply Is at a Historic Low, Home Sales Are at a 15-Year High
According to the latest Existing Home Sales Report from the National Association of Realtors (NAR), existing-home sales totaled 6.12 million in 2021 – the highest annual level since 2006. This means the market is hot and homeowners are in a great place to sell now while sales are so strong.
NAR also reports available listings by calculating the current months’ supply of inventory. They explain:
“Months’ supply refers to the number of months it would take for the current inventory of homes on the market to sell given the current sales pace.”
The current 1.8-months’ supply is the lowest ever reported. Here are the December numbers over the last five years (see graph below):
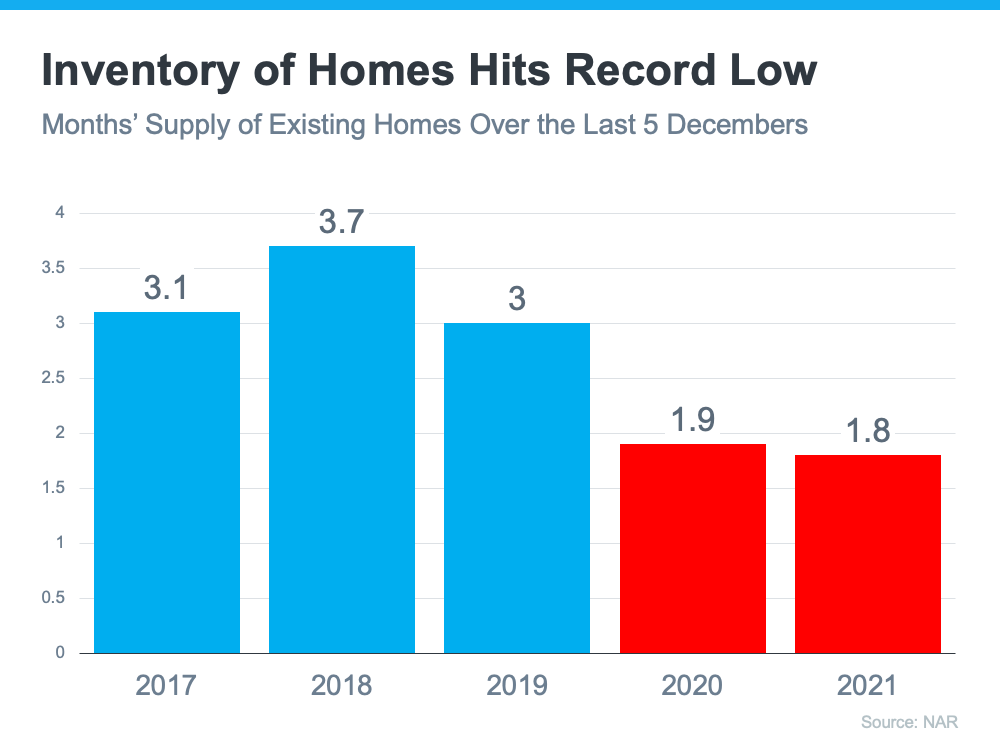
The ratio of buyers to sellers favors homeowners right now to a greater degree than at any other time in history. Buyer demand is high, and supply is low. That gives sellers like you an incredible opportunity.
Bottom Line
If you agree the best time to sell anything is when demand is high and supply is low, reach out to your trusted real estate advisor to begin discussing the process of listing your house today.
Don’t Let Student Loans Delay Your Homeownership Dreams

If you’re looking to buy a home, you may be wondering how your student loan debt could impact those plans. Do you have to wait until you’ve paid off your student loans before you can buy your first home? Or could you qualify for a home loan with that debt?
To give you the answers you’re searching for, let’s take a look at what recent data shows. That way, you know what to expect and what to do next to achieve your dream of becoming a homeowner. While everyone’s situation is unique, your goal may be more within your reach than you realize.
Do you have to delay your plans because of student loans?
If you’re worried your student loans mean you have to put your homeownership goals on hold, you’re not alone. In fact, many first-time buyers believe they have to delay their plans. According to data from the National Association of Realtors (NAR):
“When asked specifically about purchasing a home, half of nonhomeowners say student loan debt is delaying them from purchasing a home (51%).”
When asked why their student loans are putting their plans on the back burner, three key themes emerged:
- 47% say their student loans make it harder to save for a down payment
- 45% say they think they can’t qualify for a home loan because of existing debt
- 43% say they believe the delay is necessary even though they’ve never applied for a mortgage
No matter which reason resonates most with you, you should know a delay may not be necessary. Here’s why.
Can you qualify for a home loan if you have student loans?
In the same NAR report, data shows many current homeowners have student loan debt themselves:
“Nearly one-quarter of all home buyers, and 37% of first-time buyers, had student debt, with a typical amount of $30,000.”
That means other people in a similar situation were able to qualify for and buy a home even though they also had student loan debt. You may be able to do the same, especially if you have a steady source of income. Apartment Therapy drives this point home:
“. . . buying a home with student loans is possible, experts say. The proof is in the numbers, too: Some 40 percent of first-time homebuyers have student loan debt, according to the NAR study.”
The key takeaway is, for many people, homeownership is achievable even with student loans.
The best way to make a decision about your goals and next steps is to talk to the professionals. A real estate advisor can walk you through your specific situation, your options, and what has worked for other buyers like you. They can also connect you with other professionals in the industry who can help. You don’t have to figure this out on your own – lean on the experts so you have the information you need to make an informed, confident decision.
Bottom Line
Many other buyers with student loan debt are already achieving their homeownership dreams. Maybe it’s time to take the next step toward making yours a reality. Let’s connect to discuss your options and find out how close you are to achieving your goal.
Consumers Agree: It’s a Good Time To Sell

In today’s sellers’ market, many homeowners are weighing their options and trying to decide if they should sell their house. If you’re in that group, you may be balancing things like the ongoing health crisis, rising mortgage rates, and your own changing needs to determine your best time to make a move.
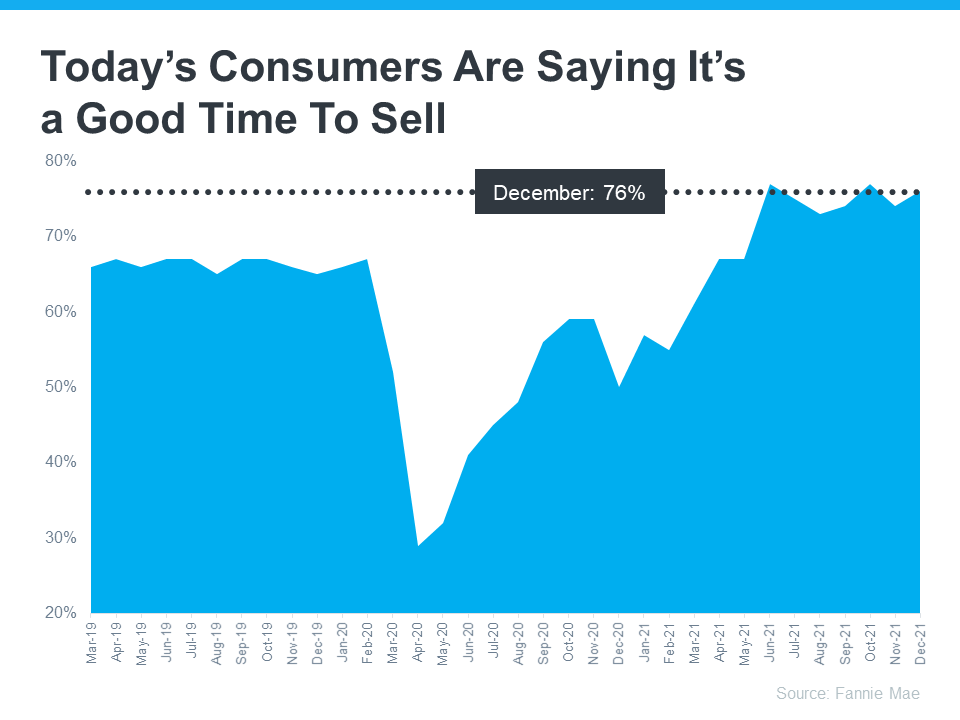
However, recent data shows that time may already be here. According to the latest Home Purchase Sentiment Index (HPSI) by Fannie Mae, 76% of consumers believe now is a good time to sell.
Looking back over the past few years, it’s clear consumers are incredibly optimistic today. The graph below shows the percentage of survey respondents who say it’s a good time to sell a house, and their positive outlook is on the rise. The big dip near the middle of the chart indicates how consumer sentiment about selling dropped at the beginning of the pandemic as uncertainty about the health crisis and its impact grew. The good news is, the trend today shows a continued, drastic improvement, and people are feeling more and more confident with time about selling a home.
In fact, survey respondents think it’s an even better time to sell a house today than they did in the lead-up to the health crisis. The latest survey results indicate we’re at one of the strongest peaks in seller sentiment since March of 2019, hitting highs when 77% of people thought it was a good time to sell only twice before in June and October of 2021.
Why Are Consumers So Optimistic About Today’s Housing Market?
From record-high equity gains to record-low housing supply and significant buyer demand, homeowners have more motivation than ever to sell. There are more buyers in today’s market than there are homes for sale, and that’s driving home prices up, making it a great time to sell your house.
According to the National Association of Realtors (NAR), the current supply of homes for sale today is at a 1.8-month supply, which is an all-time low. When the supply of homes for sale is low, sellers will likely see more offers, which is exactly what’s happening right now. As NAR notes:
“The average home for sale is receiving 3.8 offers today, up from 3.3 offers just one year ago.”
Bottom Line
With the inventory of houses for sale so low today pushing home prices in an upward direction, it’s no wonder consumers think it’s a good time to sell.
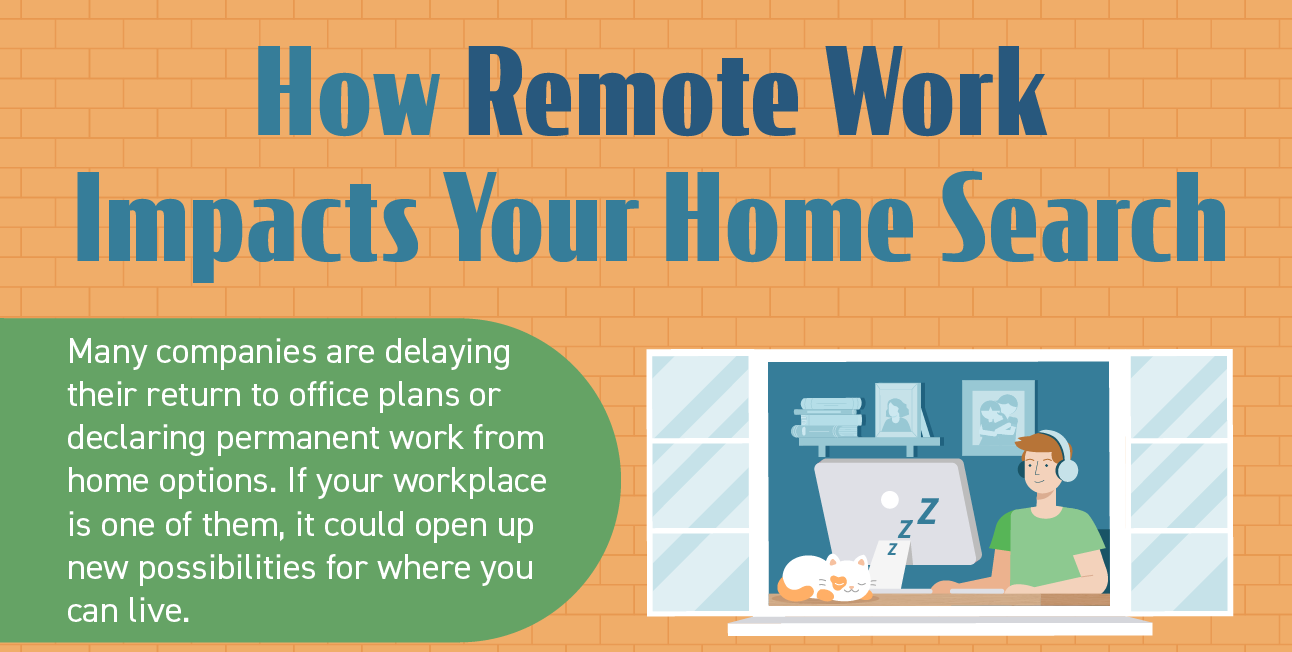
How Remote Work Impacts Your Home Search
![How Remote Work Impacts Your Home Search [INFOGRAPHIC] | MyKCM](https://files.mykcm.com/2022/02/03134442/20220204-MEM-1046x2435.png)
Some Highlights
- If your workplace is delaying its return to office plans or is allowing permanent work from home options, that may open up new possibilities for your home search.
- Ongoing remote work could give you the chance for a change in scenery, a move to an area with a lower cost of living, or finding a home with more home office space.
- If you want to learn more about how remote work can give you more options, let’s connect to discuss your situation and priorities for your home search.
Q4 2021 Eastern Washington Real Estate Market Update

Written By Matthew Gardner, Chief Economist – Windermere Real Estate
The following analysis of the Eastern Washington real estate market is provided by Windermere Real Estate Chief Economist Matthew Gardner. We hope that this information may assist you with making better-informed real estate decisions. For further information about the housing market in your area, please don’t hesitate to contact your Windermere Real Estate agent.
REGIONAL ECONOMIC OVERVIEW
The Eastern Washington economy has proved remarkably resilient to the effects of the pandemic, having recovered all of the jobs that were lost and adding more than 20,500 more. Every county except Whitman shows employment levels above their pre-pandemic peak. It should be added that this report considers total employment, not just non-agricultural jobs, so the numbers are higher than might be expected. With the job market expanding at a solid pace, it is not a surprise to see the unemployment rate continuing to trend lower. As of November 2021 (the most recent data available), only 3.4% of the workforce was unemployed—down from the pandemic peak of 14.9%.
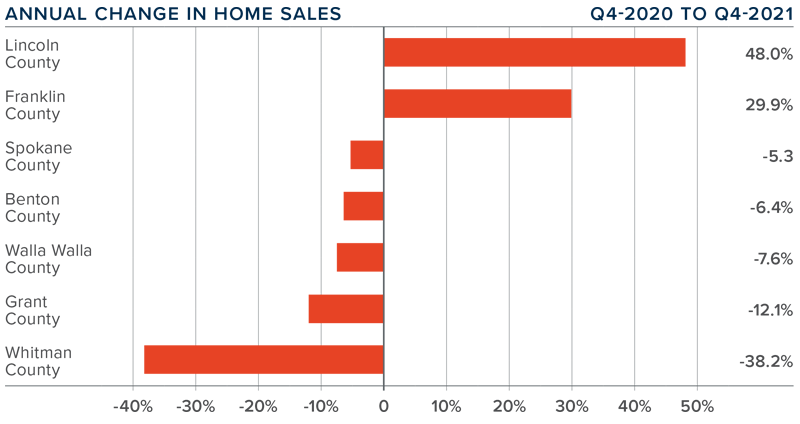
EASTERN WASHINGTON HOME SALES
❱ In the final quarter of 2021, 3,714 homes sold, down 5.1% compared to the same period in 2020. Sales were also 10.3% lower than in the third quarter, but this was mainly due to seasonal changes in the market.
❱ The number of home sales was disappointing, and though we might suspect the slowing is due to a lack of homes for sale, listings were down by less than 1%, which makes the drop in sales somewhat puzzling.
❱ Year-over-year, sales rose in two counties but fell in the other five. Compared to the third quarter, sales fell everywhere but Franklin County.
❱ Whether it was the rise of new COVID-19 infections, inclement weather, or rising mortgage rates, the main culprit behind the slowdown in sales is unclear. I will be very interested to see how the market performs in the first quarter of the new year.
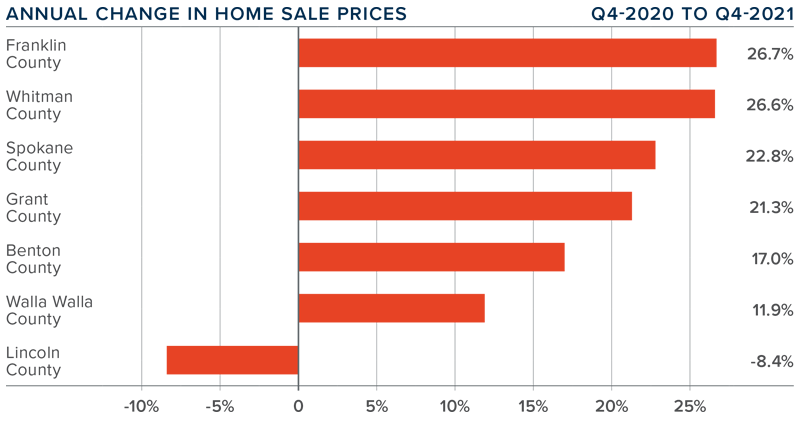
EASTERN WASHINGTON HOME PRICES

❱ Year-over-year, the average home price in Eastern Washington rose a very significant 21.3% to $423,870 but pulled back by a modest .4% compared to the third quarter of the year.
❱ When compared to third quarter, prices rose in Benton, Franklin, and Walla Walla counties. Prices remained static in Lincoln County and dropped in the rest of the market areas.
❱ Lincoln County saw prices drop compared to the previous year, but it is a small market, which makes it prone to significant swings. The balance of the counties contained in this report saw prices rise at double-digit rates across the board.
❱ Mortgage rates rose .3% between October and the end of the year, which may have impacted near-term price growth. That said, Spokane County is now technically unaffordable for a buyer making the median income and every county other than Lincoln is unaffordable for first-time buyers. Price growth is likely slowing due to lower affordability.
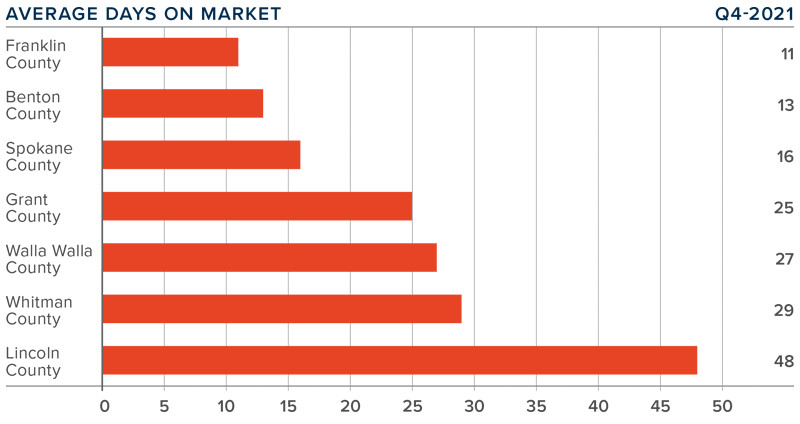
DAYS ON MARKET
❱ The average time it took to sell a home in Eastern Washington in the final quarter of 2021 was 24 days.
❱ During the quarter, it took seven fewer days to sell a home in Eastern Washington than it did a year ago.
❱ All markets other than Lincoln saw the average number of days-on-market drop compared to the same period in 2020, with significant declines in Walla Walla (-23 days) and Whitman (-13 days) counties.
❱ It took ten more days to sell a home in the quarter than it did during the third quarter of this year.
CONCLUSIONS

This speedometer reflects the state of the region’s real estate market using housing inventory, price gains, home sales, interest rates, and larger economic factors.
Solid employment gains continue in Eastern Washington, but the housing market appears to have taken somewhat of a breather. Housing data for the winter months can be a little frenetic, but the signs of a slowdown are there. Although it is far too early to suggest that this is the case, it will be interesting to see how the market performs in the spring, especially considering rising mortgage rates and falling affordability levels.
Ultimately, only time will tell, but it seems that the Eastern Washington market is poised for a move back to some sort of balance—at least given the current data. As such, I have moved the needle a little toward home buyers, but it remains a seller’s market.
ABOUT MATTHEW GARDNER

As Chief Economist for Windermere Real Estate, Matthew Gardner is responsible for analyzing and interpreting economic data and its impact on the real estate market on both a local and national level. Matthew has over 30 years of professional experience both in the U.S. and U.K.
In addition to his day-to-day responsibilities, Matthew sits on the Washington State Governors Council of Economic Advisors; chairs the Board of Trustees at the Washington Center for Real Estate Research at the University of Washington; and is an Advisory Board Member at the Runstad Center for Real Estate Studies at the University of Washington where he also lectures in real estate economics.
Millions of Americans Have Discovered the Benefits of Multigenerational Households

If your needs are changing, you may be thinking about sharing a home with additional loved ones, such as grandparents, adult children, or other extended family members. Whether it’s for financial or health-related circumstances, or simply because you’ve reached a new phase of life, you might be wondering if living with multiple generations under the same roof is a good move for you. Many people have found themselves in a similar situation and they’ve already made the choice to live in a multigenerational home.
What Is a Multigenerational Home?
The Pew Research Center defines a multigenerational household as a home with two or more adult generations. They include households with grandparents and grandchildren under the age of 25. As you weigh your options and decide if multigenerational living is right for you, here’s some helpful information highlighted by other homeowners living with additional loved ones.
The Benefits of Multigenerational Living
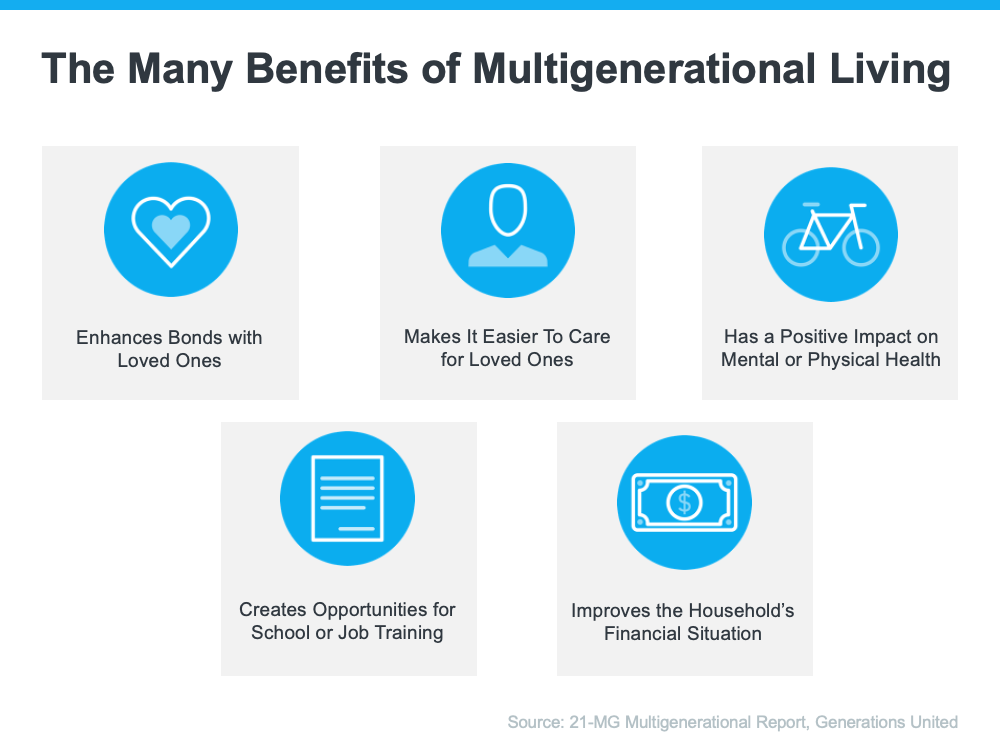
A recent report from Generations United surveyed individuals living in a multigenerational setting and asked them about the key benefits of this housing arrangement. It says:
“Nearly all Americans who live in a multigenerational household (98%) feel their household functions successfully, citing various aspects of home design, family relationships and interactions, and supports and services influencing their success.”
The study identifies some of the top benefits of this lifestyle as an improved financial situation, better mental and physical health, strengthened bonds with loved ones, and more (see chart below):
Those are just some of the reasons why most people who decide to live in this situation find it worthwhile. As Donna Butts, Executive Director at Generations United, says:
“Families may come together from need, but they are staying together by choice. Indeed, more than 7 in 10 (72 percent) of those currently living in a multigenerational household plan to continue doing so long-term.”
With More Adults Living Under One Roof, You May Need More Space
If you decide to look for a multigenerational home, it’s important to understand what everyone will need to make the arrangement work to its fullest. Something that often makes the top of the list for homeowners living with multiple generations is additional space for privacy. This could mean more bedrooms and bathrooms or features like an in-law suite or a basement.
If you’re realizing your current house doesn’t provide the room you need for multigenerational living, an expert real estate advisor can help you navigate the process to find the right home that works for you and your loved ones.
Bottom Line
Living in a multigenerational household has real and impactful benefits. If you’re interested in learning more about these options in our local area, get in touch with your trusted real estate advisor today to find a home that fits your changing needs.
The Top Indicator if You Want To Know Where Mortgage Rates Are Heading

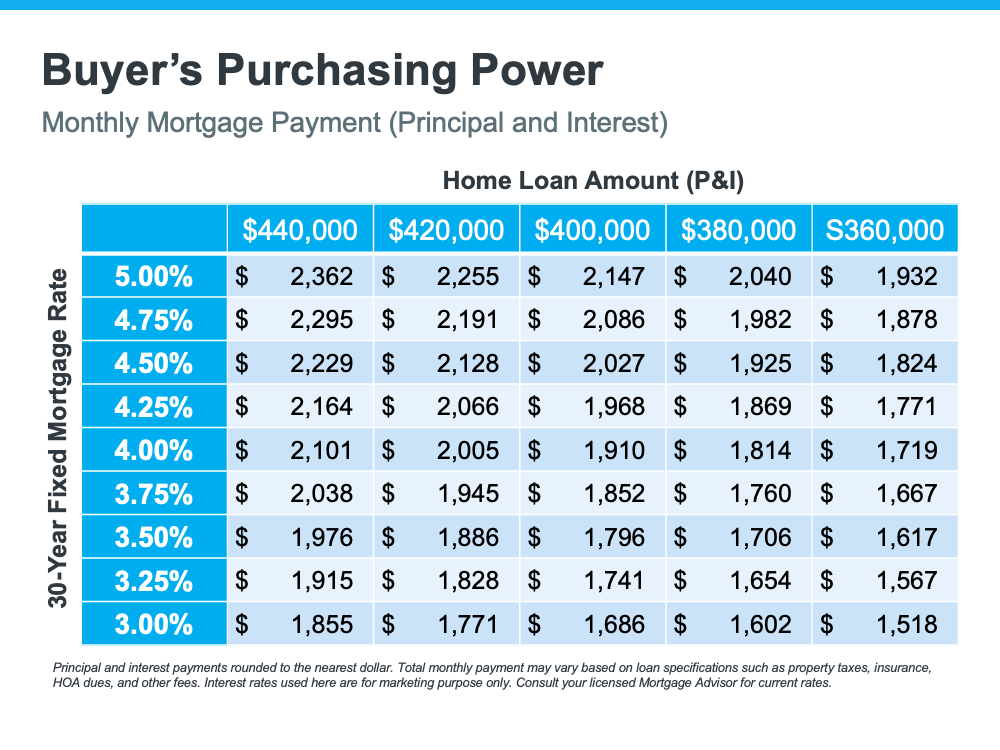
Mortgage rates have increased significantly since the beginning of the year. Each Thursday, Freddie Mac releases its Primary Mortgage Market Survey. According to the latest survey, the average 30-year fixed-rate mortgage has risen from 3.22% at the start of the year to 3.55% as of last week. This is important to note because any increase in mortgage rates changes what a purchaser can afford. To give you an idea of how rising mortgage rates impact your purchasing power, see the table below:
How Can You Know Where Mortgage Rates Are Headed?
While it’s always difficult to know exactly where mortgage rates will go, a great indicator of where they may head is by looking at the 50-year history of the 10-year treasury yield, and then following its path. Understanding the mechanics of the treasury yield isn’t as important as knowing that there’s a correlation between how it moves and how mortgage rates follow. Here’s a graph showing that relationship over the last 50 years:
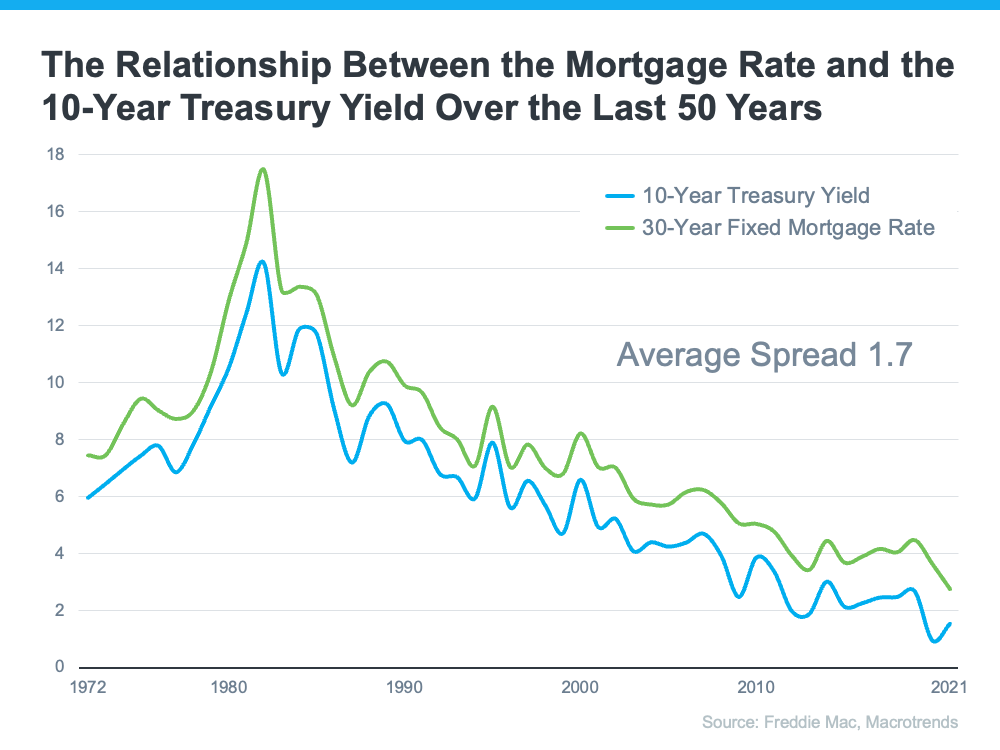
This correlation has continued into the new year. The treasury yield has started to climb, and that’s driven rates up. As of last Thursday, the treasury yield was 1.81%. That’s 1.74% below the mortgage rate reported the same day (3.55%) and is very close to the average spread we see between the two numbers (average spread is 1.7).
Where Will the Treasury Yield Head in the Future?
With this information in mind, a 10-year treasury-yield forecast would be a good indicator of where mortgage rates may be headed. The Wall Street Journal just surveyed a panel of over 75 academic, business, and financial economists asking them to forecast the treasury yield over the next few years. The consensus was that experts project the treasury yield will climb to 2.84% by the end of 2024. Based on the 50-year history of following this yield, that would likely put mortgage rates at about 4.5% in three years.
While the correlation between the 30-year fixed mortgage rate and the 10-year treasury yield is clear in the data shown above for the past 50 years, it shouldn’t be used as an exact indicator. They’re both hard to forecast, especially in this unprecedented economic time driven by a global pandemic. Yet understanding the relationship can help you get an idea of where rates may be going. It appears, based on the information we have now, that mortgage rates will continue to rise over the next few years. If that’s the case, your best bet may be to purchase a home sooner rather than later, if you’re able.
Bottom Line
Forecasting mortgage rates is very difficult. As Mark Fleming, Chief Economist at First American once said:
“You know, the fallacy of economic forecasting is don’t ever try and forecast interest rates and or, more specifically, if you’re a real estate economist mortgage rates, because you will always invariably be wrong.”
However, if you’re either a first-time homebuyer or a current homeowner thinking of moving into a home that better fits your changing needs, understanding what’s happening with the 10-year treasury yield and mortgage rates can help you make an informed decision on the timing of your purchase.


